The claim
Which of these jobs will be the first to decline to less than 50% the number of workers it had in May, 2022?
Procedure
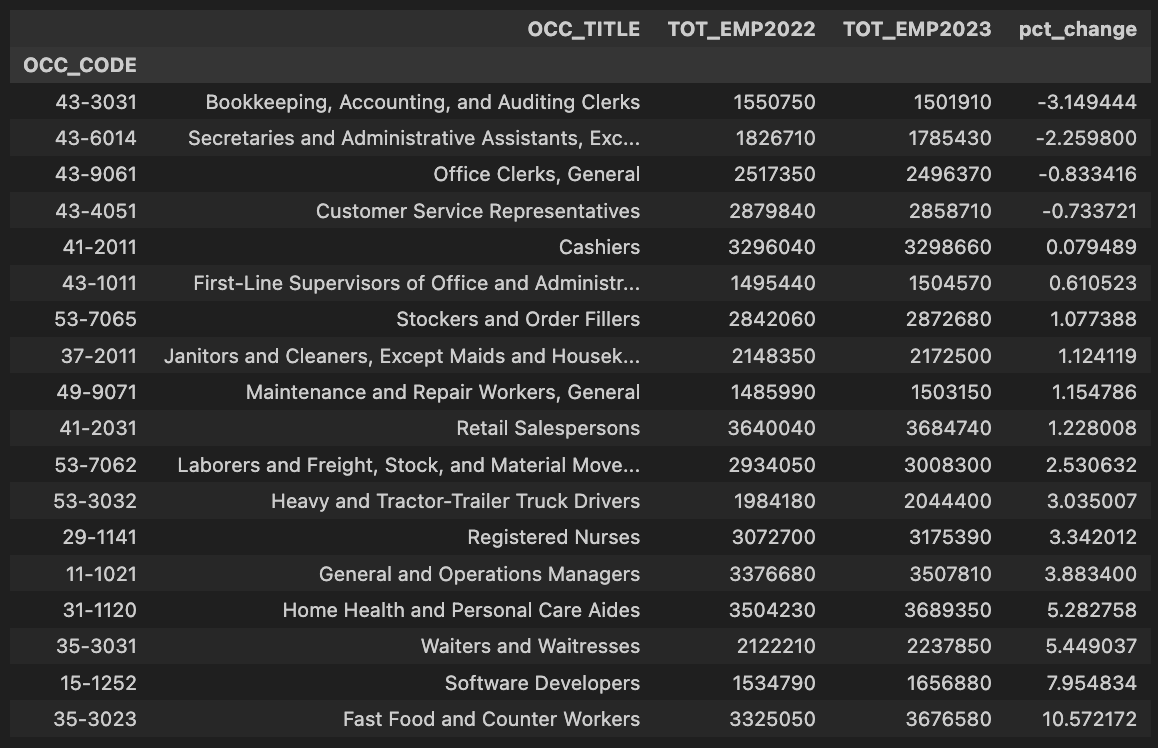
So, every year we check the result (looks like the reports are annual, in May) and look at the decrease levels. If there is a decrease such that the level at that point is <50% the starting, 2022, value, then that one wins.
If in one year TWO or more jobs decrease to <50%, then whichever one decreased more relative to the original will be deemed the "most decreasing" job.
Also, every year I will update the name of each to display how much it's gone down, and maybe what percentage that is. I will adjust the deadline as time goes by, until we get a hit.
Data
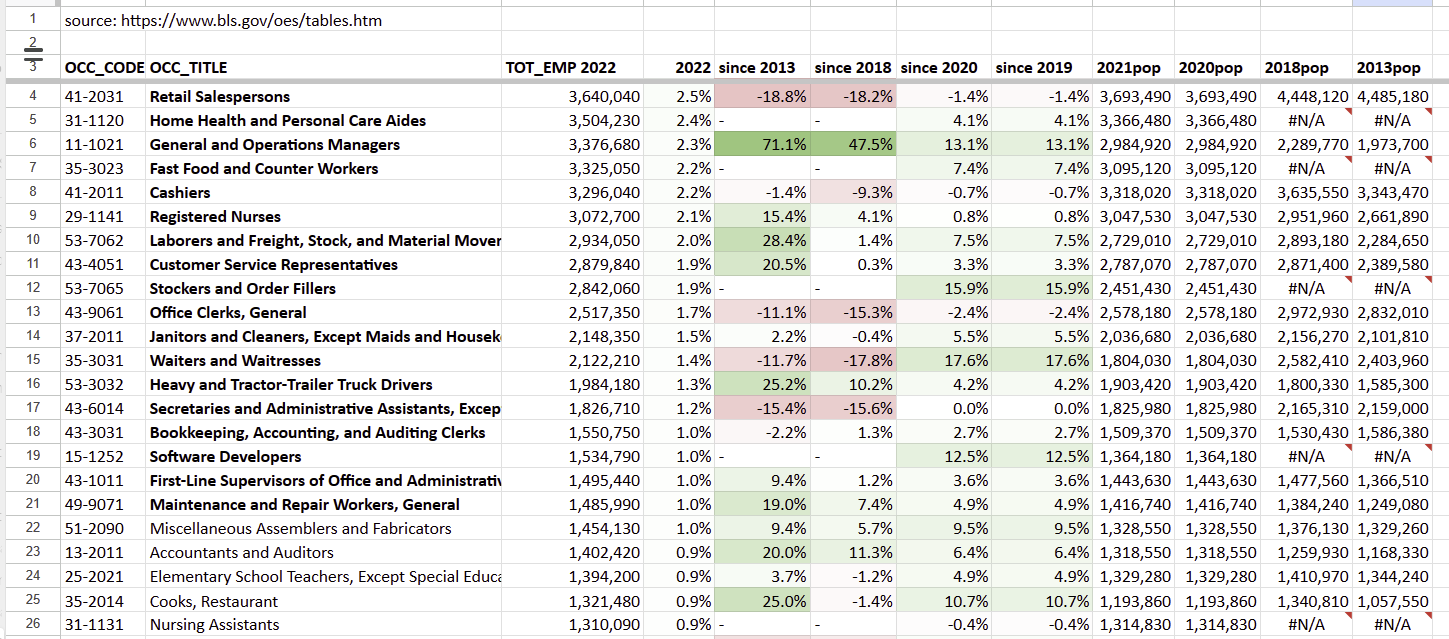
I listed out 18 jobs which were the biggest individual categories in the US in 2022 from US Government data.
Note that this means that jobs with fewer absolute people, like maintenance workers (with only 1.5m people) have an easier time going to below 50% since the number of people is lower than it would take for "Retail Salespersons" to decline 50%. But that's up to you to decide how to handle.
Also, note that I ignore population changes. So if there is a dramatic but equally distributed decrease in the US population, then that might cause an early YES. This is unfortunate; I'd like to scale the jobs relative to something meaningful. But, so many things might be changing that who knows what will happen! People may just quit working en masse, or there may be a reclassification, too. In general I will attempt to patch obvious reclassifications into something sensible, but that is a huge can of worms and I'd rather be slightly legalistic here to make judging possible.
I pulled occupational employment data from https://www.bls.gov/oes/tables.htm
(National => XLSX => google sheets)
I filtered down just to the detailed job level (to avoid duplication of people from within higher categories)
Then I ordered them by number of workers. It looks like this:

I also added some historical data so you could see how things change. Unfortunately some top jobs have had definition changes recently, but you can still overall see the rough rates of change.
Here is a link to the spreadsheet where I'm tracking in an ongoing way.
https://docs.google.com/spreadsheets/d/1HtEfBaWJr6RI0Gpnqz8qEZ-PoxI4TQyS6nOvc4osyOU/edit?usp=sharing
Updates:
From eyeballing the missing jobs since 2013, it seems like sometimes it's fairly straightforward to reclassify. It'd be a lot of work to do it historically, but for our purposes, I have no problem doing it w/market help if necessary.
@JamesGrugett thanks! Yeah it's a fun one. I can't figure out how to get mc markets to go viral like Joshua does otherwise I'd create a lot more of them. This dataset in particular has lots of interesting bits. The top paid jobs, rare jobs, every subspecialty
People constantly talk crap about ai and job changes yet nobody bets on it.
Problem is it only has one "event" to drive interest per year.
