
Data is currently at
https://data.giss.nasa.gov/gistemp/tabledata_v4/GLB.Ts+dSST.csv
or
https://data.giss.nasa.gov/gistemp/tabledata_v4/GLB.Ts+dSST.txt
(or such updated location for this Gistemp v4 LOTI data)
January 2024 might show as 124 in hundredths of a degree C, this is +1.24C above the 1951-1980 base period. If it shows as 1.22 then it is in degrees i.e. 1.22C. Same logic/interpretation as this will be applied.
If the version or base period changes then I will consult with traders over what is best way for any such change to have least effect on betting positions or consider N/A if it is unclear what the sensible least effect resolution should be.
Numbers expected to be displayed to hundredth of a degree. The extra digit used here is to ensure understanding that +1.20C resolves to an exceed 1.195C option.
Resolves per first update seen by me or posted as long, as there is no reason to think data shown is in error. If there is reason to think there may be an error then resolution will be delayed at least 24 hours. Minor later update should not cause a need to re-resolve.
Edit (14 Apr 2025):
May 2025 Market added
https://manifold.markets/ChristopherRandles/global-average-temperature-may-2025?play=true
 1,000
1,000 3.00
3.00Went through not so small amount of work after finding a major error today in the original area calculation code I wrote almost 2 years ago, and had to revise a lot of code.
Sadly I've been handicapping myself this entire time by accidentally effectively using only the southern hemisphere (some simple tests like making sure the total area was being calculated correctly passed as two bugs contributed to doubling the contribution of a single hemisphere temps) (ARIMAX AR term corrected for much of the recent error since I started using it, but now that is no longer needed, so its a simpler 1,0,0 model now).
The temperature from the tau=0 (00Z,06Z,12Z,18Z) and tau=0,6 (00Z,12Z) runs are now a tight fit to a simple linear regression to fit the ERA5 data (RMSE ~= 0.05 and a slope ~= 1 for all models):i.e.:
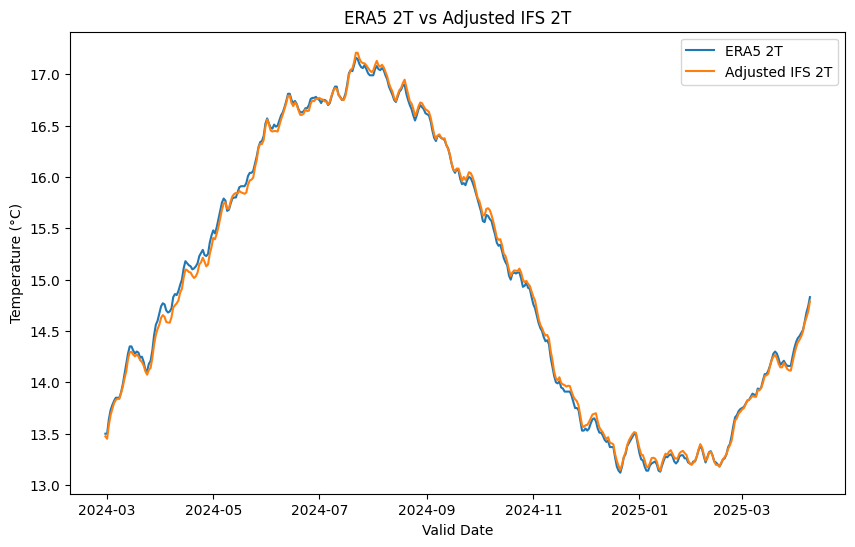
After some re-computing all the past temperature data I use and updating hte ARIMAX models to 1,0,0 all the models have come in much closer alignment:
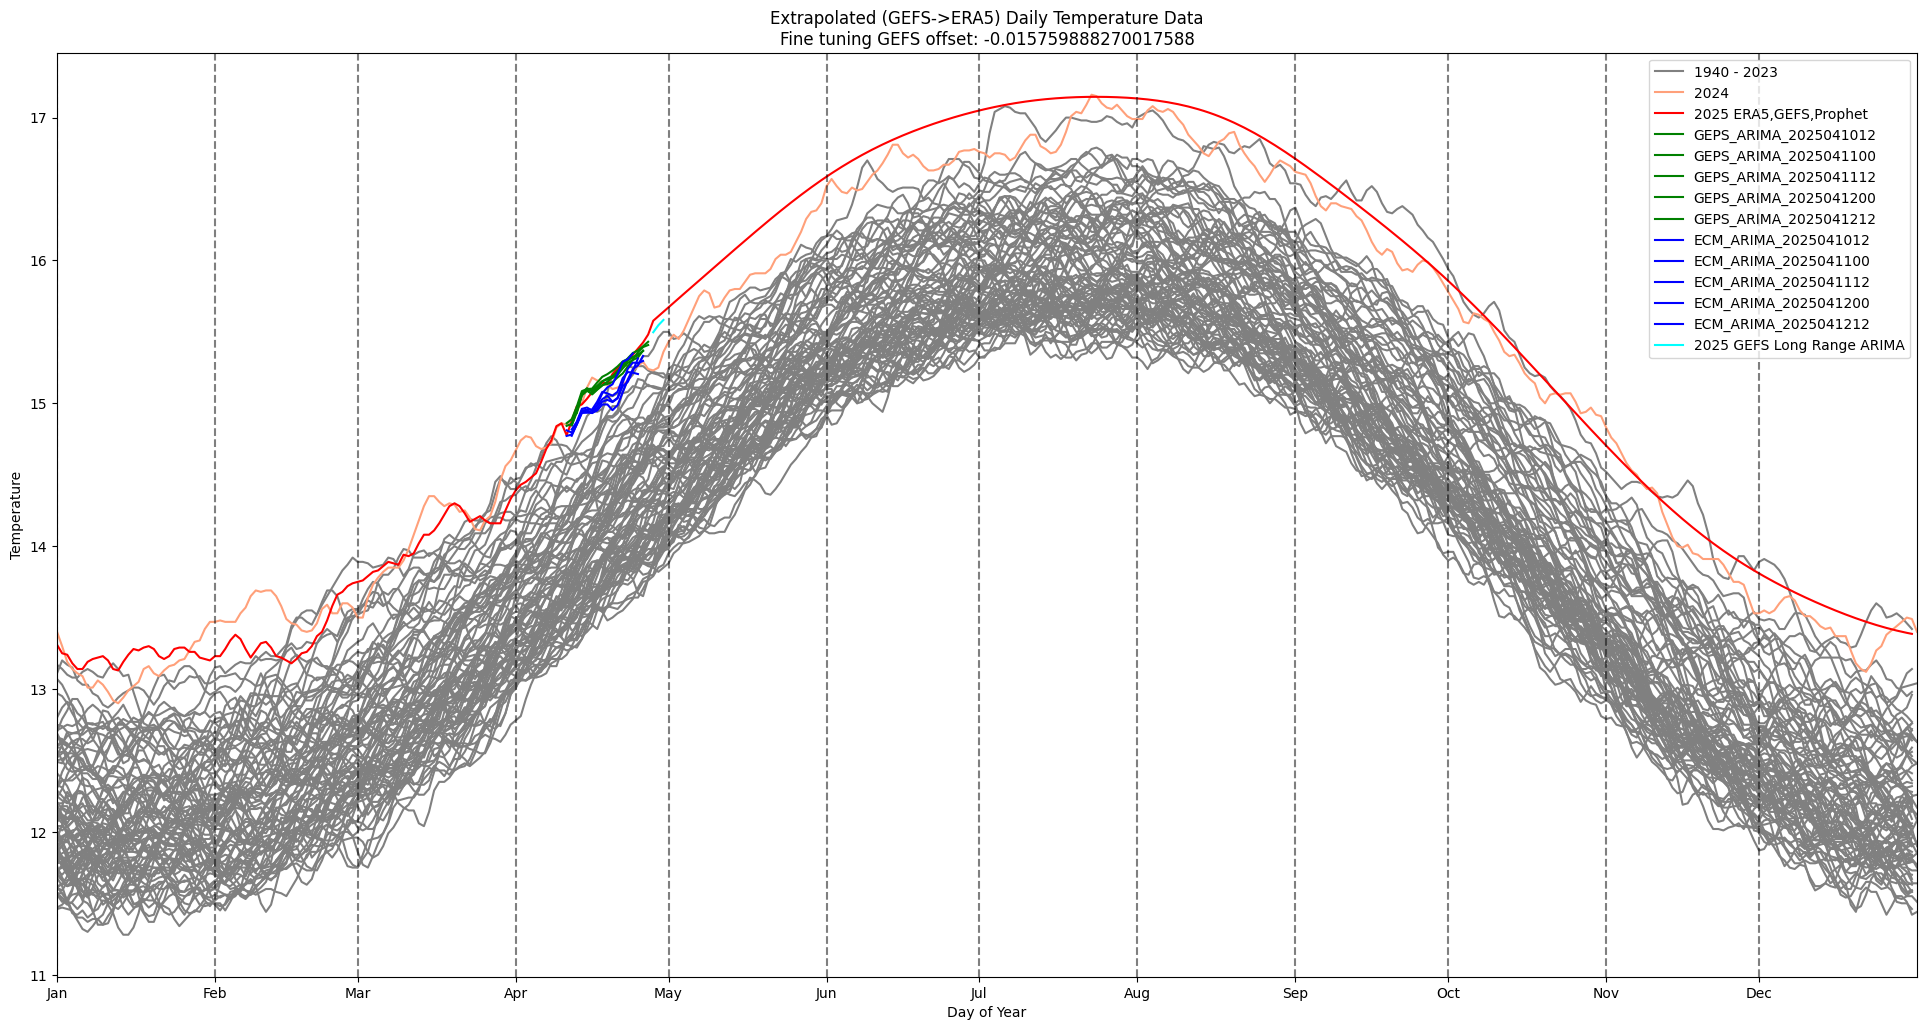
GEPS & GEFS mostly agree, with last few ECM deterministic models running cool.
The long range GEFS (hindcast ARIMAX adjusted) for the last few days of the month is also now producing more reasonable temps and is consistent with the end of the latest medium range forecast.

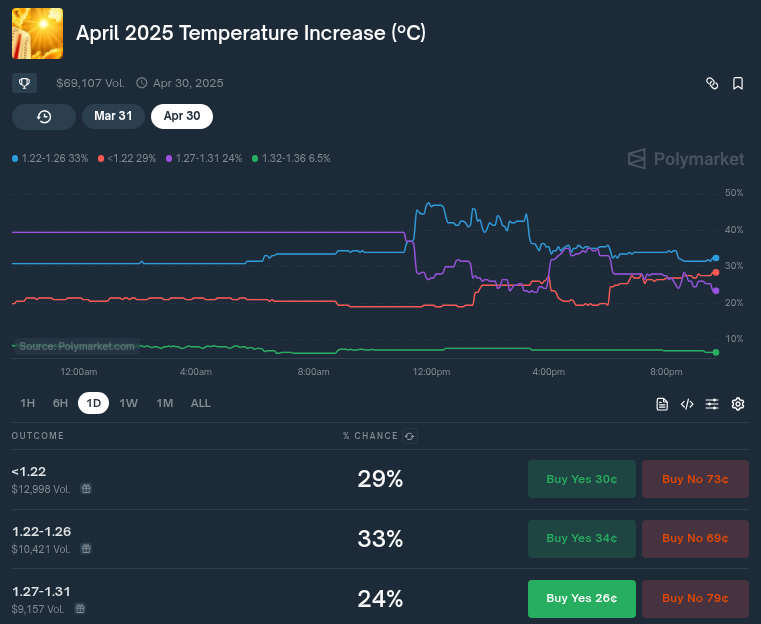
Edit: after checking Polymarket I find they agree now with the final point estimate I come up with (~1.225 C):

I look forward to see if my final point estimates are now more or less stable now that major bugfix is done..
Weighted by estimate of std. dev. for offset:
[ 0. 0. 0. 0.
8.23529412
17.64705882
40.
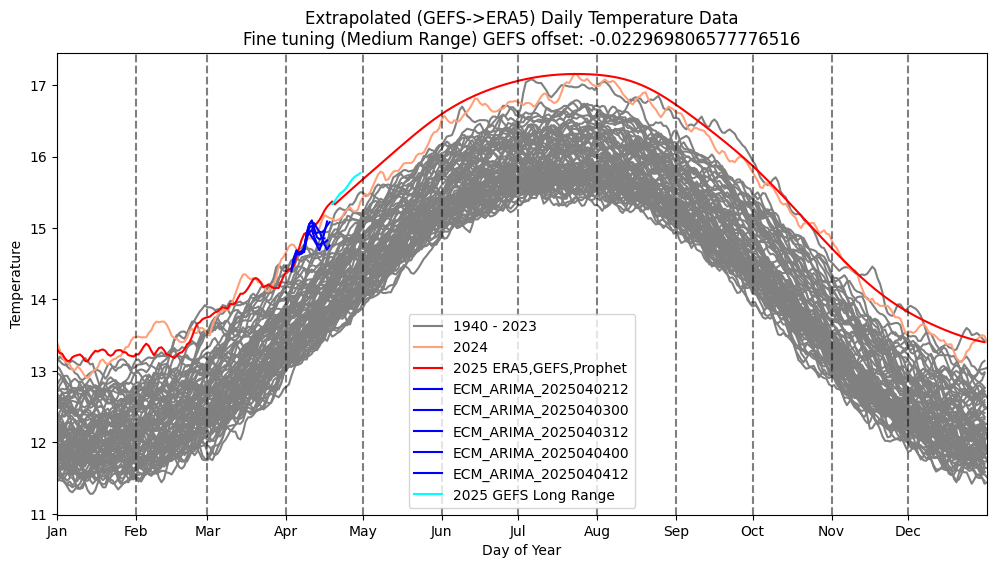
34.11764706]Have added GEPS (rolling 5 run average == 2.5 days) to medium range forecast: so I now equally weight GEFS, GEPS, ECM (ARIMAX adjused) over the medium range, and GEFS long-range and Prophet for beyond (referencing the adjusted Prophet from the post-medium range multi-model adjustment).
I found a significant bug in the ECM arimax offsets code I used earlier (resolving that abnormal discontinuity at the beginning of the forecast period). This had the effect of dropping the ECM forecast temps (they are in stark contrast to GEFS). Notably GEPS has little variation across the same number of runs (given that it has 21 members, this smoothing may be why -- as the ECM runs are single-shot deterministic).
After a small dip for the next day or so, GEFS still shows a sharp rise in a few days (a ~ 0.2 C temp increase from April 14th to April 15th).
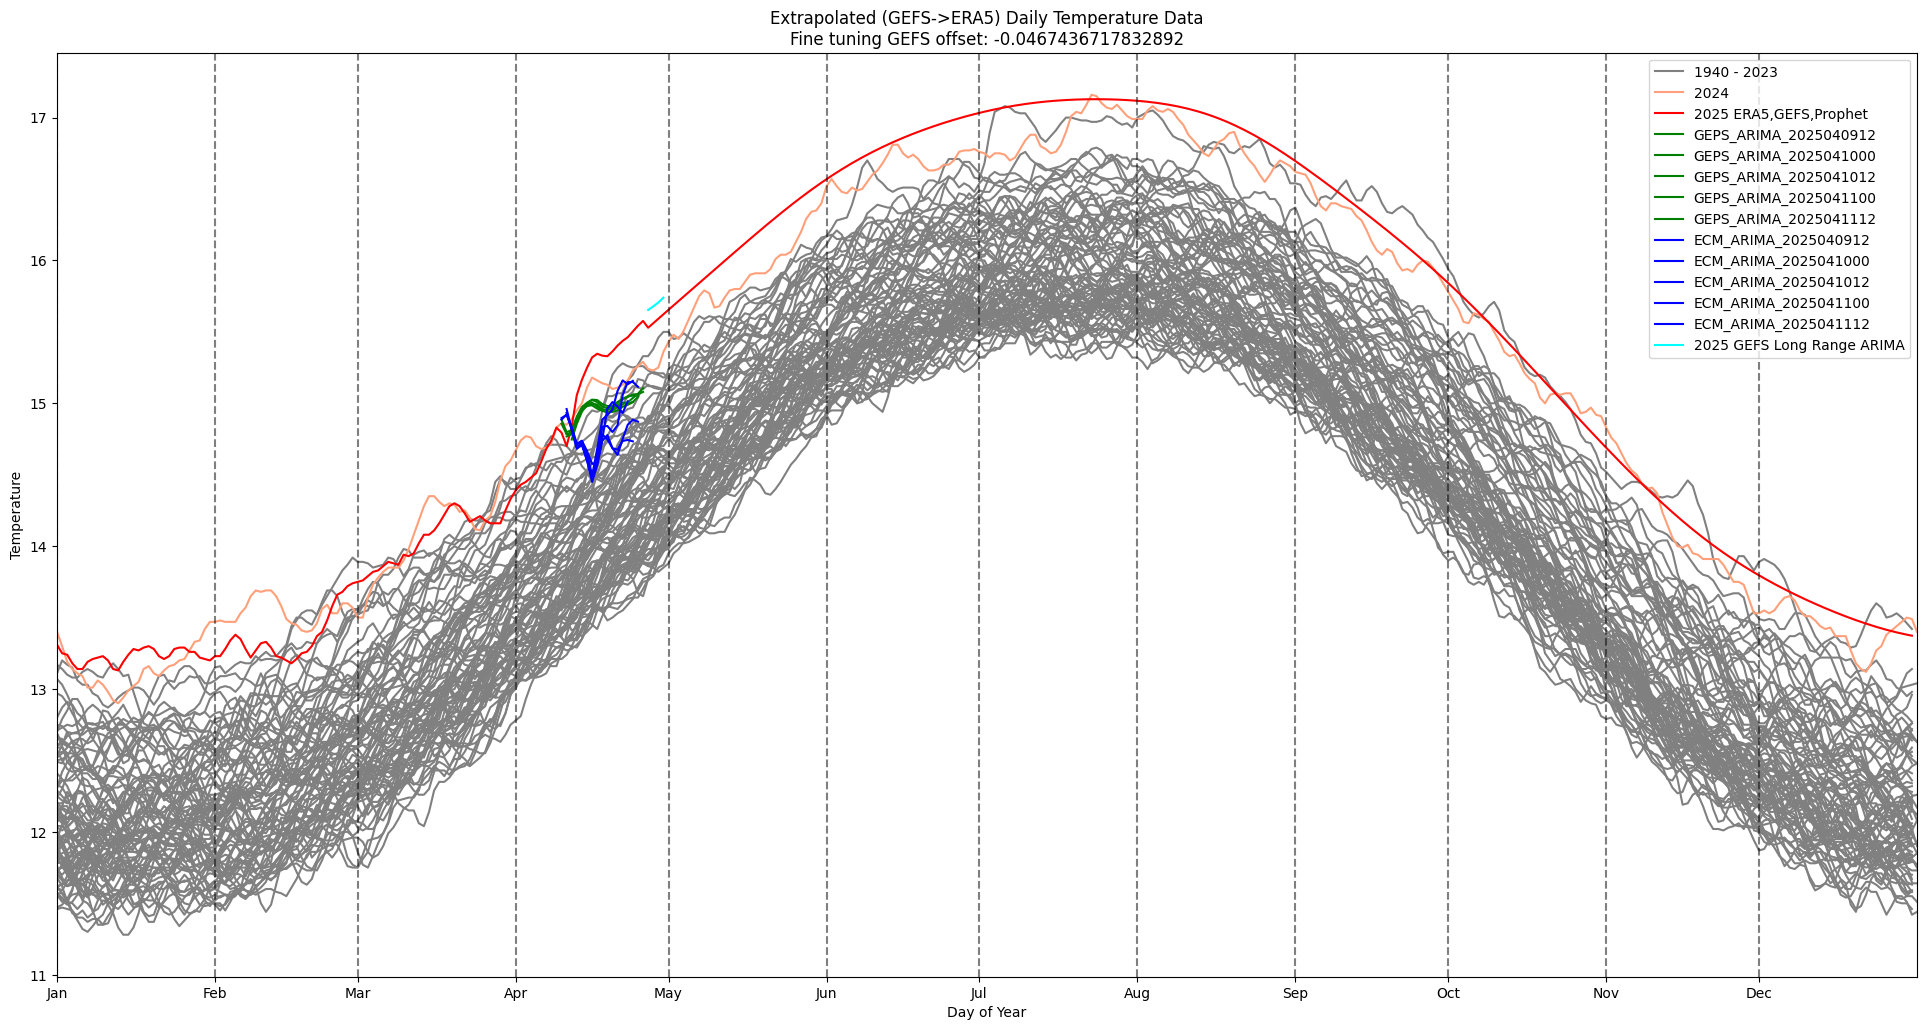
The long range GEFS (after splitting with the adjusted Prophet from the medium-range multi-model split) is still pushing up the temps though:
Average GEFS (Split offset adjusted) - ECM_ARIMA (mean of recent runs fit with ARIMA to ERA5): 0.23
Average GEFS (Split offset adjusted) - GEPS_ARIMA (mean of recent runs fit with ARIMA to ERA5): 0.08
Multi-model Offset (Split offset adjusted) - GEFS|GEPS|ECM (mean of recent runs fit with ARIMA to ERA5): 0.09
Multi-model medium range mean offset (GEFS, GEPS, ECM): 0.0923
Long range mean offset (GEFS|Prophet): -0.1702

Multi-model mean offset (Medium and Long Range): 0.0467For reference, in the latest dataset gistemp run I have April 2024 as 132.04 (~ same as official 1.32), so the highest bin will ~ correspond to a tie or higher of 2024 (if it does not get adjusted downwards in the future)..
Changed the way prophet extends GEFS for remainder of month (don't try to manually adjust the trend so its smooth from historical to forecast period -- I think anecdotally based on past behavior I've observed it's better to leave it alone than try to make it not have any jumps on the first prophet forecast date).
Reference probabilities I'm loosely using at this point is the grey line: from splitting the ARIMAX adjusted GEFS + prophet and ARIMAX adjusted ECM and re-weighting probabilities by shape of distribution (expected value by offset std dev)

If I have time I'll try some experiments tomorrow to see if I can use the long-range full GEFS perturbation set with all 31 members (rather than just the average) from old wednesday forecast runs to improve upon Prophet (it will be tough to validate though for putting it to use, as it is time consuming and resource consuming to run the tests let alone write them -- each set of 31 members temperature data is ~900+MB for a single mode run, so I don't even have enough disk space to do check more than a few of them). If anyone has attempted this let me know how it worked out.
Current Polymarket for April for reference:
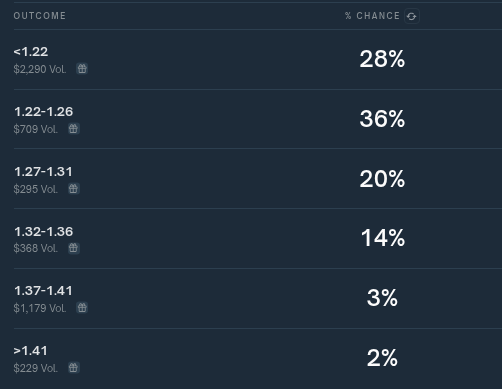
They use quite different bins but my point forecast isn't too inconsistent with Polymarket's current estimate.
Current fit,arimax adjusted GEFS (+Prophet), ECM split forecast for April (ignore past April)
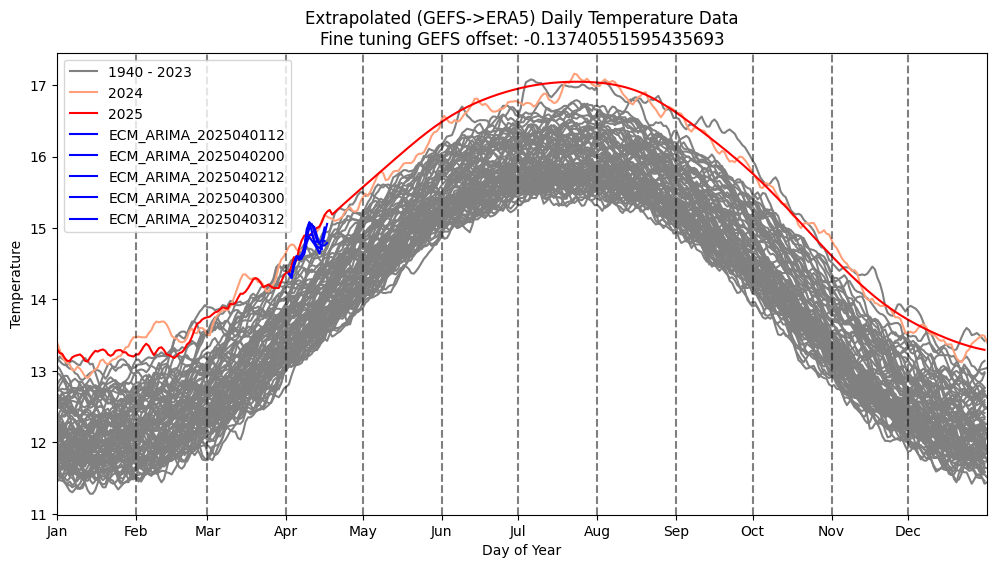
Later this year ECMWF will be providing open access to its data so we will have access to its long range forecast products (including I believe its long range ensembles), but for now have only statistical extrapolation and other long range models like GEFS to guide us).
I have preliminiarily added long-range GEFS forecasts (not bias adjusted?) to work flow. Are they worse than statistical projections (like from Prophet) for this question? Validation is out of scope and resources for me. I will find out how it does experimentally in April later this month, but for now the GEFS mean is super aggressive for end of month (nearly 0.3 C above ERA5 record for May 1). I do recall this GEFS adjusted version was also super aggressive last month as well relative to ECM despite downward adjustments from ARIMAX.
I am weighting the combined medium range GEFS runs equally with the ECM runs, and trying to also weigh the average temperature is in between the statistical prediciton from prophet and the long range GEFS.
The difference in final temps for a prediction for LOTI from the two methods is 1.267 (Prophet) to 1.321 (Splitting the difference between all the methods).
The following is what the long-range Wednesday (init. April 2, 2025) forecast looks like after fitting to ERA5 data with a linear regression (the model isn't significantly different from GEFS-BC) (red is calculated mean):
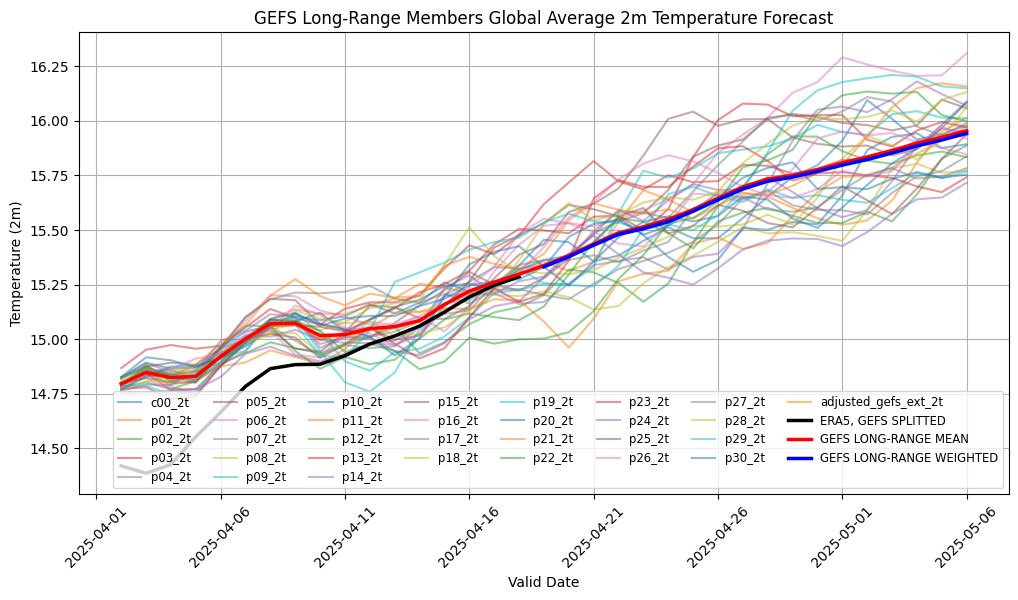
Most of the black line is actually lower as an adjustment (prediction) by ARIMAX and splitting the average with the ECM data, which is also lower (i.e. the black line is not the GEFS data but derived from it)
For this run, trying to weight by performance of ensemble members with naive methods (by trying to 'recalibrate' it to the newer forecast data by MAE or RMSE) doesn't result in any appreciable difference from the mean. This may change as more ERA5 data comes in to overlap (for now there is only a single point) so most of it is just recalibration a couple days apart.
New GEFS long range is out -- not much difference (still quite a bit above prophet, and even more so above the last ECM run (not shown) at the start (April 23)):
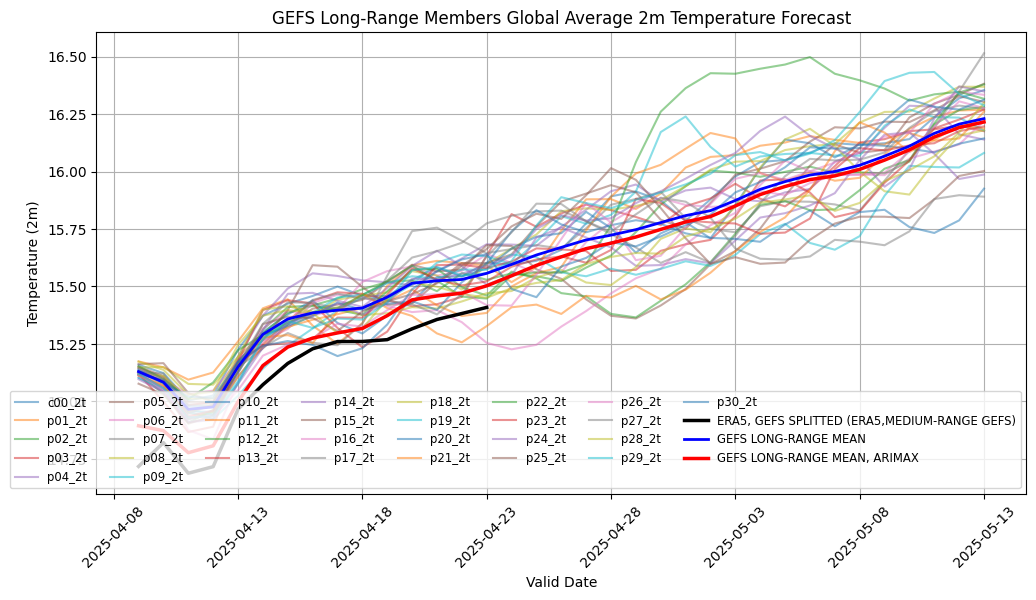
(era5 data is a day old); On the chart, the long range GEFS (even ARIMAX adjusted) looks suspectly high again.
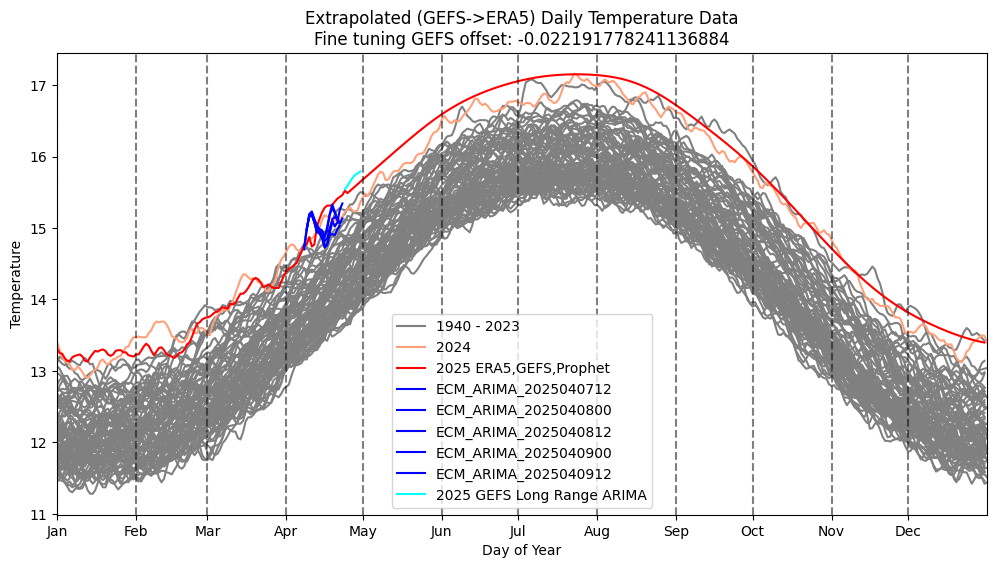
Made a quite few adjustments; among them now the long range GEFS is also now finally ARIMAX adjusted, and still the split of it with Prophet providing the statistical complement to it).
TODO: If time allows I'll add in the future the full GEPS medium-range ARIMAX members' (mean) adjusted to make it a 3-way split it between ECM, GEFS, GEPS for the medium range forecast mean temp (~15 days).
I've also been meaning to add the medium GEFS members as well so I can get a better guess of the skew, kurtosis for the entire medium+long range but this requires a more complete MCS across all forecasts and models (and there is no free ECM ensemble data available yet -- so this means either abandoning this approach or abandoning the ECM data to generate a more proper distribution; alternative is only a very wooly guess of the skew/kurtosis for the aggregate of these mixtures as I'm doing already).
Notably GEFS medium range temps got downgraded (especially today's temps) and ERA5 preliminary was a bit lower than expected, so the entire GEFS extended forecast also got downgraded a bit as well (as ARIMAX is sensitive to values immediately around the end of the hindcast and beginning of the forecast period)


Last 5 ECM runs and GEFS medium range still in disagreement about the trend for the middle of the month is not a great sign either.
Edit: I checked polymarket and they also not only seem to have downgraded their forecast earlier today (April 10 around noon?) but as it stands now the bins are now more evenly split which I interpret to better reflect perceived increase in uncertainty after this downgrade (the point prediction I reference dropped ~ 0.03 C since last night).
Edit 2: On some reflection I realized it may be more likely just people updating on the ACTUAL gistemp data being released today (maybe people reran with the official data? -- I haven't been using the official gistemp data output for quite some time and just been using my own gistemp runs since they are unrounded)