Data is currently at
https://data.giss.nasa.gov/gistemp/tabledata_v4/GLB.Ts+dSST.csv
or
https://data.giss.nasa.gov/gistemp/tabledata_v4/GLB.Ts+dSST.txt
(or such updated location for this Gistemp v4 LOTI data)
The relevant figure for resolving this question is the J-D column for the 2024 year.
January 2024 might show as 122 in hundredths of a degree C, this is +1.22C above the 1951-1980 base period. If it shows as 1.22 then it is in degrees i.e. 1.22C. Same logic/interpretation as this will be applied.
If the version or base period changes then I will consult with traders over what is best way for any such change to have least effect on betting positions or consider N/A if it is unclear what the sensible least effect resolution should be.
Numbers expected to be displayed to hundredth of a degree. The extra digit used here is to ensure understanding that +1.20C does not resolve an exceed 1.205C option as yes.
First plausible number I see or is pointed out to me shall be used for resolution. This is so that subsequent revisions to data should not cause re-resolution unless there is a clear problem with the first resolution data used.
Keeping track... only 1 of 7 last days would report 129, and that would be if they used the ghcnm data from 0105 (and ran it with latest data on Monday), which still seems fairly plausible... otherwise it would show up as 128. I don't think it's likely they'll run it tomorrow night/Friday morning, as they are holding a press conference Friday afternoon...
ghcnm.v4.0.1.20250108:
Dec: 125.72612890923598
J-D: 128.32506017944806
First data is out so far (ersstv5 and ghcnm.v4.0.1.20250102). I've disabled rounding in my output:
December: 122.40471513853517
J-D: 128.23000003229893
For reference:
the J-N temps are:
[124.68843887028969,143.87668780871718,139.4106948577912,131.4610827309448,115.89740305351785,124.15915908368066,120.12897933450859,130.1902285093382,123.39833991623057,133.4571554016688,129.68711568236444]
and thus, the exceedance temps for Dec to fall into the bins above (skipping the first bin as they are exceedance), based on the above are now:
[0.7764471475094794, 0.8964471475094768, 1.0164471475094778, 1.136447147509477, 1.2564471475094763, 1.3764471475094773]That means it has to increase a bit more than 3 with the new data... which is possible in the next week but not incredibly likely? this makes the 1.28C more likely now (not sure how much?), and all other bins extremely unlikely.
A few of the last few days measurements from ERA5 have GEFS coming in a bit colder than earlier averages (about -0.05C)...
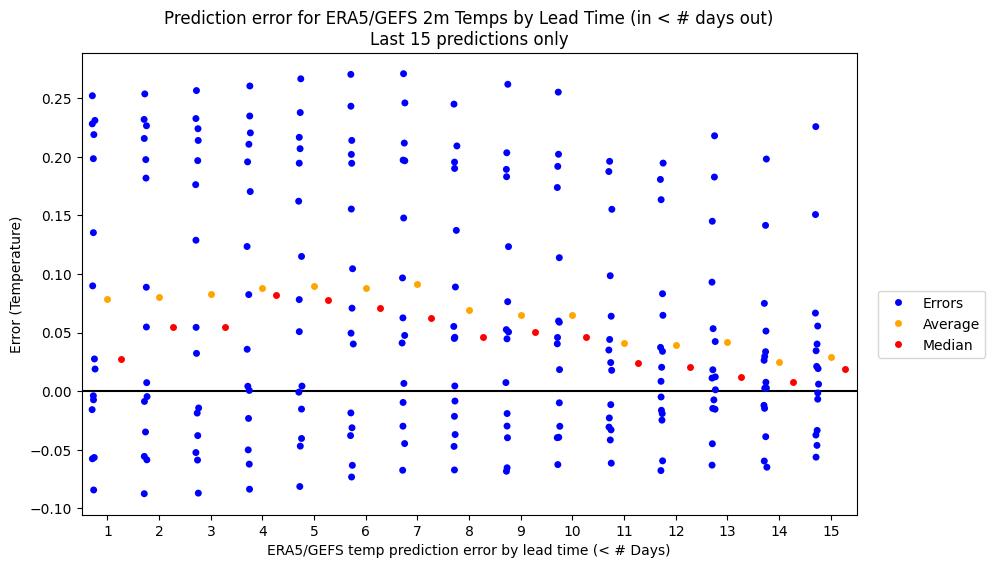
but even if they are on average cooler by -0.1C (indicating a December gistemp of 1.255C for an offset of 0.1C, although a 0 C offset seems most likely as a meta prediction still), my current model still puts most of the probability towards 1.28 C
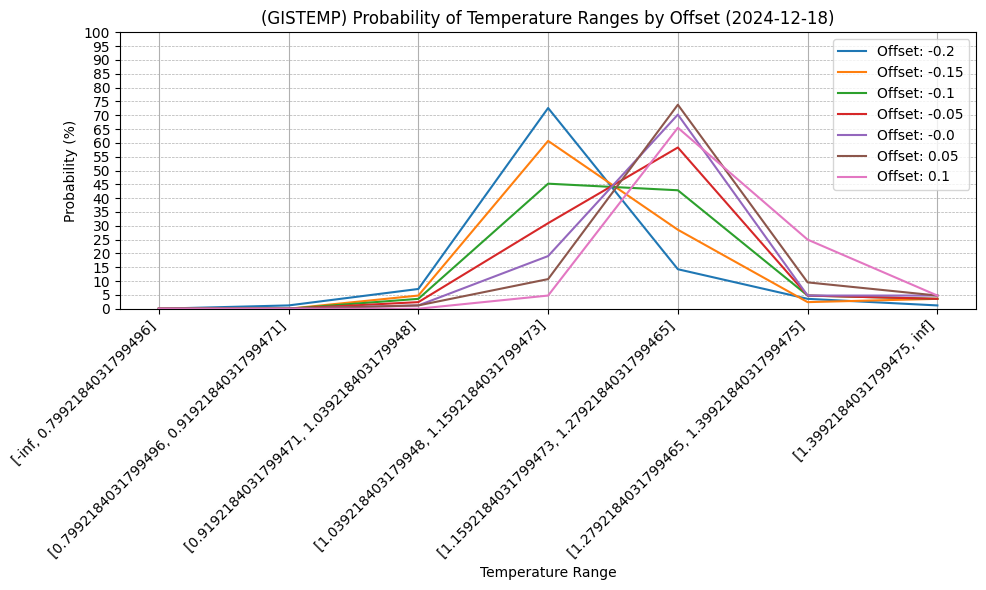
It will take a very warm end of December (5-25%) to push it towards 1.29 C which doesn't look yet likely
Well ~ 1.29C for December looks most likely to me after a relatively large GEFS error predicting the ERA5 temps for the last remaining days, which puts the temperature for the year at either 1.28C or 1.29C, which was better odds than previously....
For now I'm betting now on about a +0.2C offset on average for the outstanding ERA5 temps which places the 1.28C and 1.29C for the year at even odds.
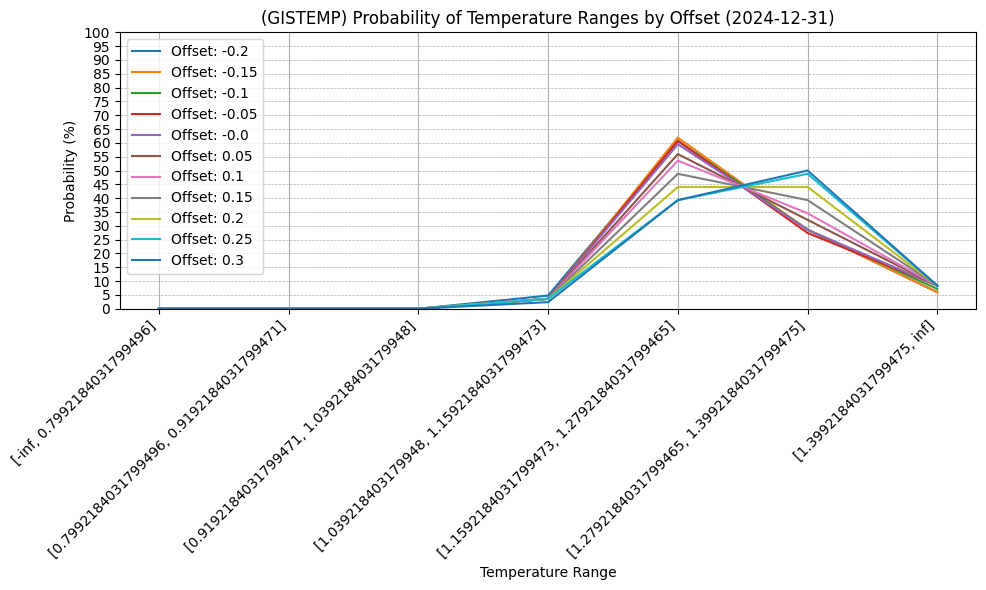
I may update once more in a couple days once the final ERA5 data comes out for the year...
Had to add an extra coment for future self reference, to correct? a conclusion I made in my original comment far below, as I needed to double check the above...
The distribution of the CDF clears it up when looking at point probabilities...
I said earlier that December needed to be >1.279C to make it to the Annual 1.29C bin. This is indeed the case and I do predict it is possible, with the greatest point probability:
GIS TEMP anomaly projection (December 2024) (corrected, assuming -0.094 error, (absolute_corrected_era5: 13.330)):
  1.286 C +-0.097
Despite predicting December will be shown as 1.29 C, because the rounding is done at the very end, most of the probability in the distribution seems to be actually still slightly tilted towards the Annual being 1.28C -- this is despite the mean Dec temp falling in a bin that corresponds to 1.29C (can imagine the distribution being slightly fatter on the left side -- the two bins themselves are the same width of 0.12C) (the range of Dec temps that will lead it to the annual 1.28 bin are in aggregate more likely rather than than the Dec temps that will lead it to the annual 1.29 bin) and the point prediction itself is placed more towards the lower end of the bin leading to Annual 1.29C. This is cleared up a bit by the exceedance charts for the Dec temps (between the first two (1.28C annual) is ~49%, and between the second two (1.29C annual) is about 38%):
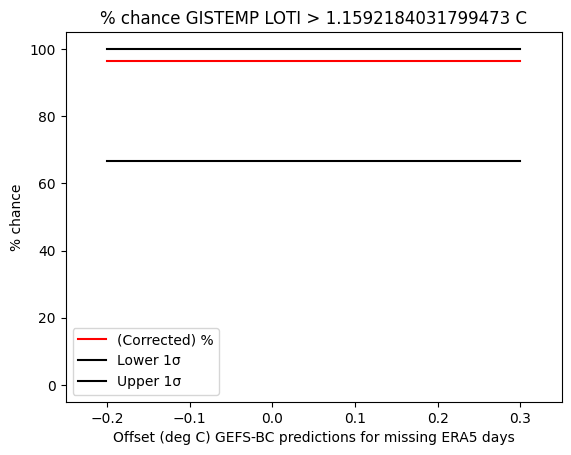
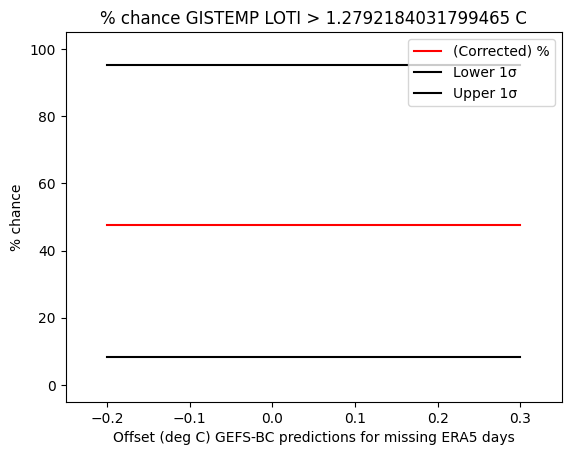
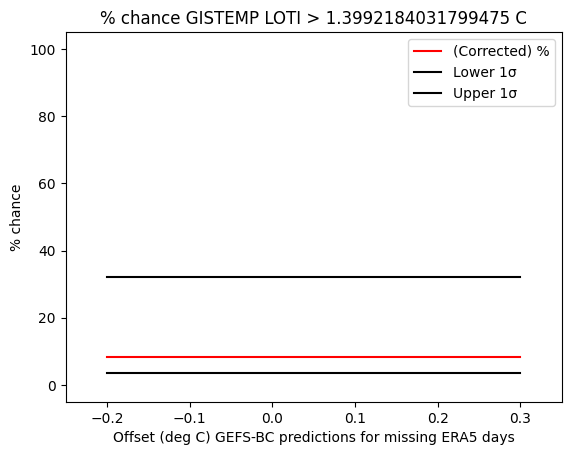
Ok... I looked at the gistemp code and it does seem that gistemp calculates the average off the unrounded monthly means and then does the rounding on the annual, so I modified some of the code to the months data from the last run's data to get full precision as this might change the results...
This is gistemp for January to November for 2024 using ghcnm.v4.0.1.20241209 (and my own ersstv5 version) in centikelvin ...
[124.25124494551324,143.43104891032047,139.0563506025243,131.27736846330365,115.68215268652695,123.98082189837416,119.95886139265997,129.95921868877284,122.96425681924441,133.05707795777147,130.45975731699357]
As you can see it was very close in terms of November being 1.30 instead of 1.31 (the last couple runs were closer to 1.30). Hopefully the following should help anyone with their J-D calculations...
Now to work backwards from this data we have to get the threshold values for December that will average and round according to this questions bins (i.e. the bin -0.5 deg C) ...
For average 1.245, GISTEMP_DEC temperature: 0.7992184031799496
For average 1.255, GISTEMP_DEC temperature: 0.9192184031799471
For average 1.265, GISTEMP_DEC temperature: 1.039218403179948
For average 1.275, GISTEMP_DEC temperature: 1.1592184031799473
For average 1.285, GISTEMP_DEC temperature: 1.2792184031799465
For average 1.295, GISTEMP_DEC temperature: 1.3992184031799475
So the new exceedance bins for December become:
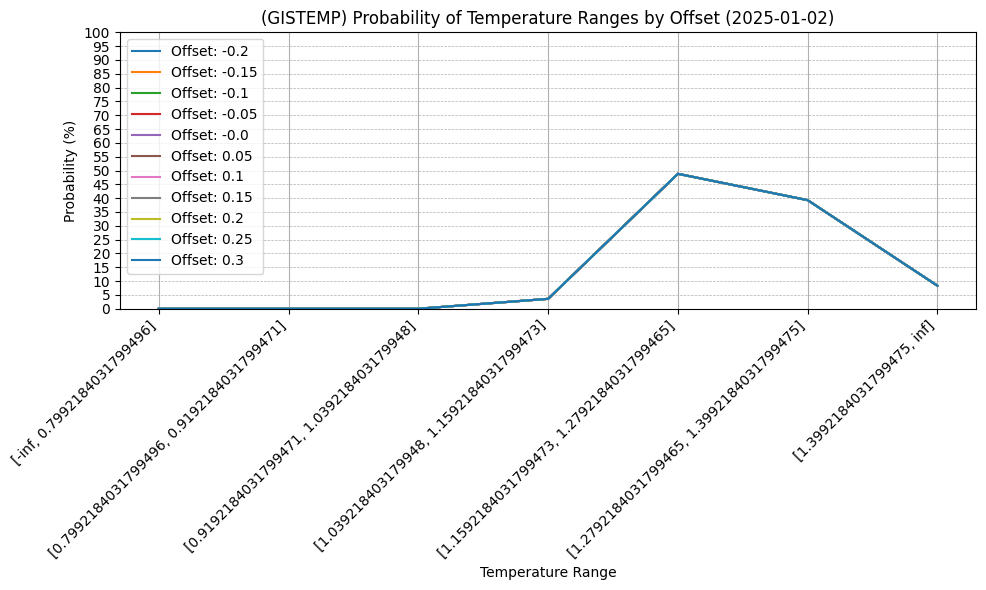
[0.7992184031799496, 0.9192184031799471, 1.039218403179948, 1.1592184031799473, 1.2792184031799465, 1.3992184031799475]and I can use the same code and copy my notebook for december now..
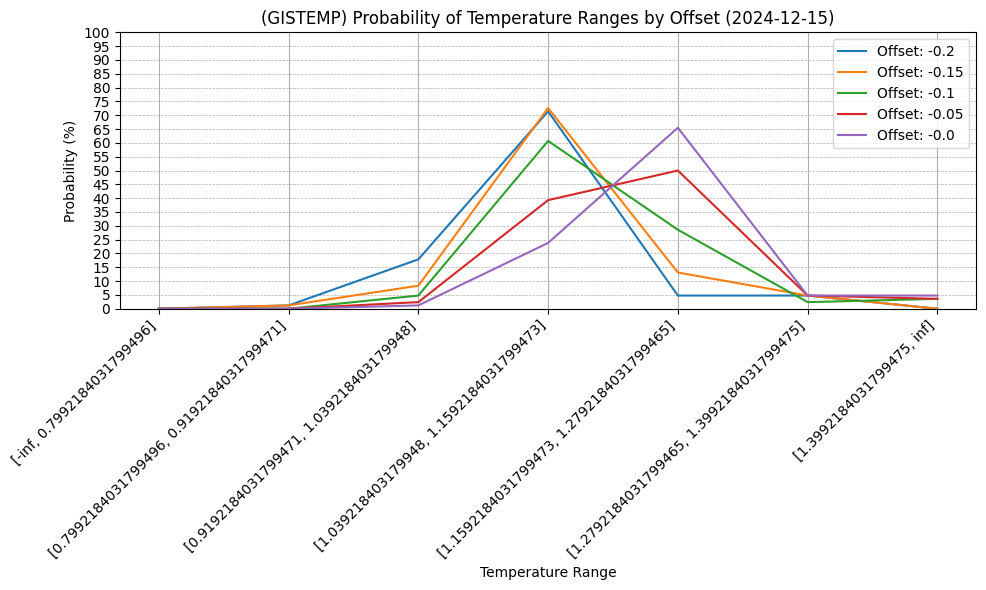
without worrying about converting back to the original bins for this question (they just correspond in order to the bins in the question anyway)... and following the 0 offset (purple line) metaprediction for ERA5->GISTEMP offsets, the one with the highest probability (1.16-1.28 for december) corresponds to the 1.28C bin for J-D.
In order to make it into the 1.29C bin it would require a Dec temp of 1.279 C.
This is not outside the CI but is closer to the end ...
GIS TEMP anomaly projection (December 2024) (corrected, assuming -0.086 error, (absolute_corrected_era5: 13.243)):
  1.199 C +-0.097
I think I actually have done a bit better this year than that CI suggests (despite some poor mana returns) and would guess I won't be more than +-0.05 C off so I am guessing its fair to bet the sum of both bins down to ~15% then ... but this is a guess and judgment call with half the month left so far...
Its possible that prior months shift further also with new ghcnm and ersstv5 data also in a few weeks, but I haven't done any sensitivity analysis on that as this is as much as I want to do effort-wise.
D-N shown as 1.29 and consensus seems likely less than last years 1.35 for Dec.
At https://manifold.markets/ChristopherRandles/global-average-temperature-december
JRP seems to believe in much lower values like less than 1.2C for Dec
This would seem to suggest 1.28 or lower, but here there seems more preference for 1.29+
